
Information graphics or infographics are graphic visual representations of information, data or knowledge. These graphics present complex information quickly and clearly, and are easy to understand. Infographics are sources of interesting information, when you are in need of some. Reading boring, long, colorless articles isn’t so attractive and interesting than reading and viewing facts and numbers in an illustrated way. Not only an illustrated way, but a very creative, attractive and super-appealing way.
All of them have been designed not only to look good, but also to expose the maximum information and data possible. These infographics were made by some very talented designers, with creative minds and superb skills.
While there are lots of really interesting and cool infographics on various topics, in this post we have only gathered awesome infographics which are of interest to web designers and developers.
Infographics for Web Designers and Developers

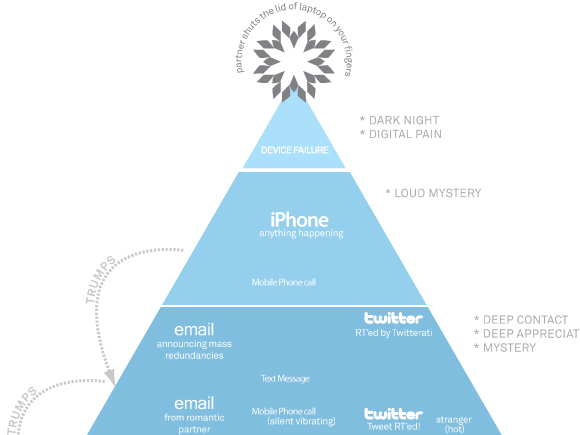
Hierarchy of Digital Distractions


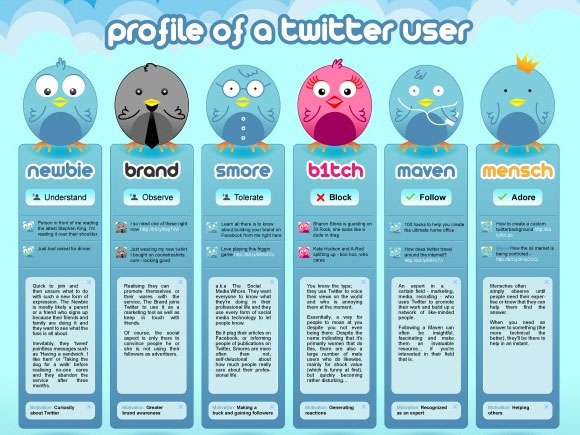
Twitter Users Profile Infographic


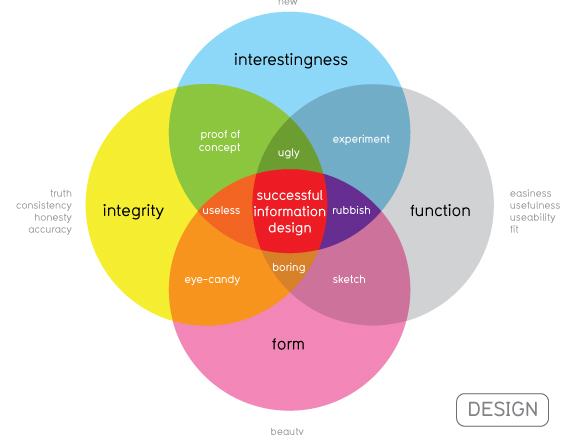
Easy Beautiful True Infographic

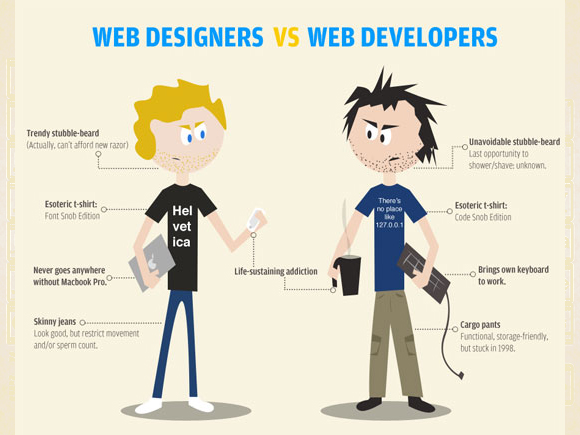
Web Designers vs Web Developers Infographic


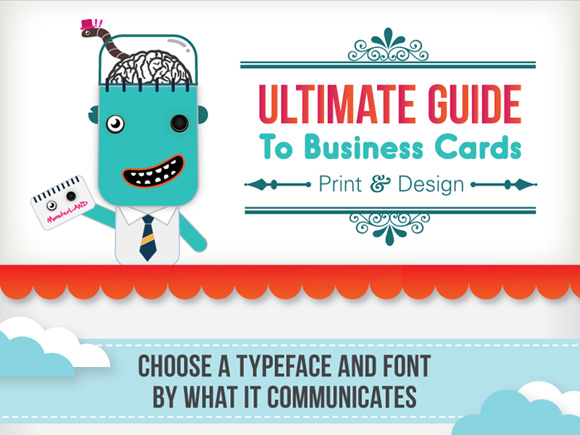
Ultimate Guide to Business Cards

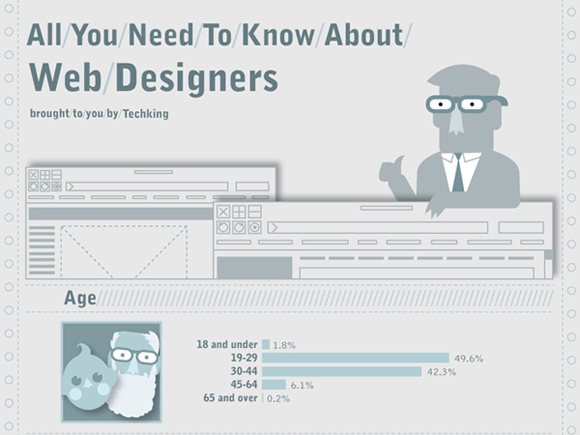
All You Need to Know About Web Designers
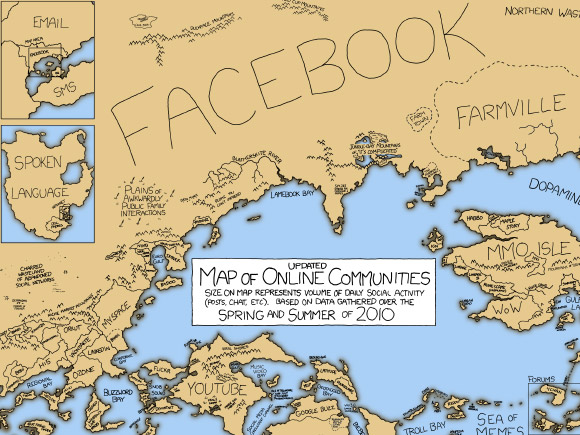
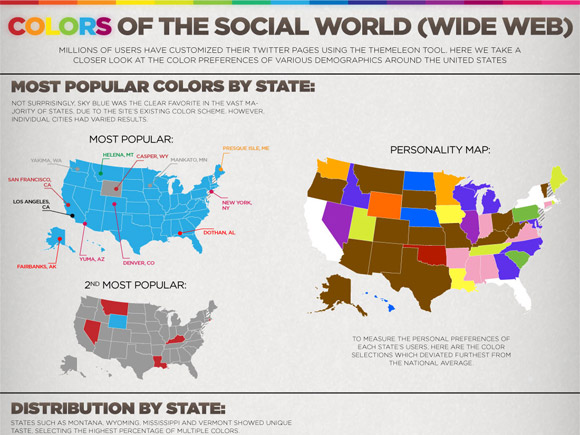
Colors of the Social World Wide Web


East Coast vs West Coast Designers

Conclusion
Infographics are, without doubt, an excellent and engaging way of imparting information for the benefit of the masses. Road signs were probably amongst the first form of infographics with their simple graphics and large type so that all the information can be comprehended by all levels of intelligence within seconds.
Do you use infographics for research or information, or do you stick with the written word such as essays, reports, etc.? We would love to hear your opinion, so please share with us.


