
Data visualization became ingrained in the life of almost every web designer and developer. If charting, mapping and dashboarding happen to have never been your pain in the neck yet, just wait a little bit as you are likely to join the club shortly.
Earlier, we featured tools to help you easily create beautiful charts and diagrams.
Today, let’s talk about the most robust JavaScript map libraries. These are designed to visualize data by means of beautiful, interactive maps that are great to identify and clarify relationships between values across different regions, view movement of objects relative to their location, and so on – precious for data analysis and business intelligence.
Interactive JavaScript Map Libraries
amMap (by amCharts)
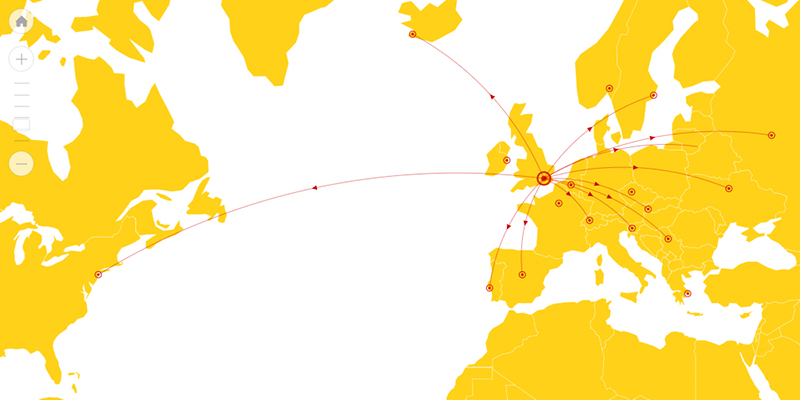
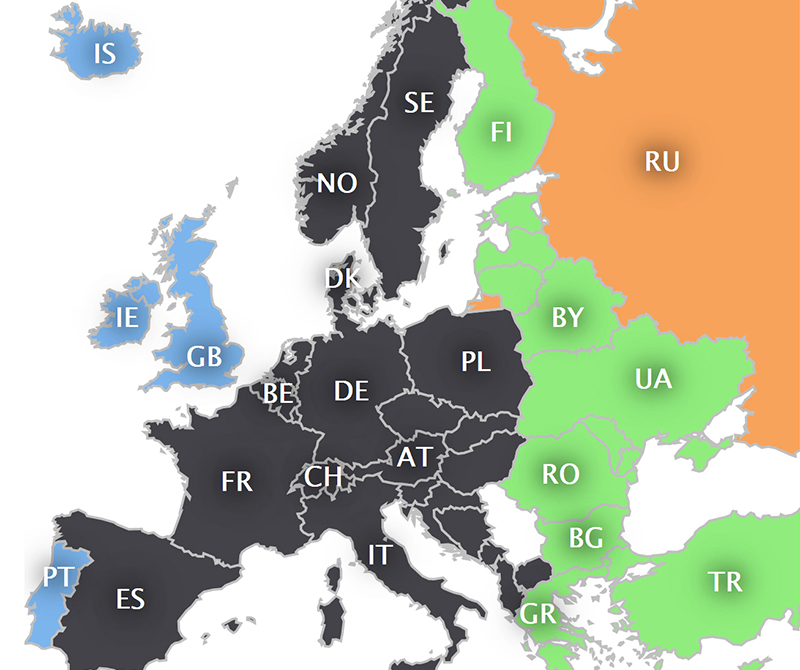
amMap is a special JavaScript (HTML5) library for maps developed by amCharts. It has no external dependencies and allows you to build beautiful choropleth, bubble, dot (or point), connector and flow maps quite easily as well as supports multiple utile interactive features.
In particular, you can easily “dive” into any part of your map with the help of the drill down feature. Also, amMap give you the power to use any images as markers, which is a cool thing.
To get started with amMap, you need to download a ZIP file with binaries which contains 400+ maps in each of the supported formats – JS/SVG.
amMap’s documentation is not really big and boils down to a set of questions and answers.
API reference: yes.
Dependencies: none.
Licensing: free (branded) or paid (from $140).
AnyMap (by AnyChart)
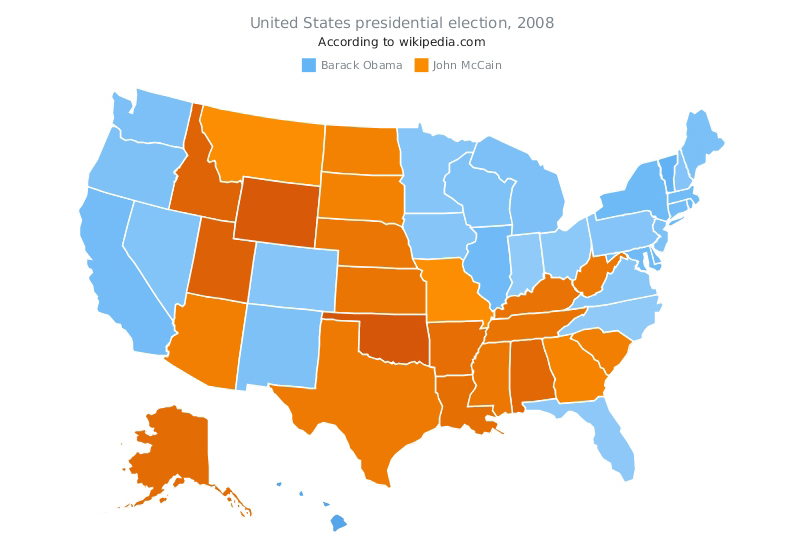
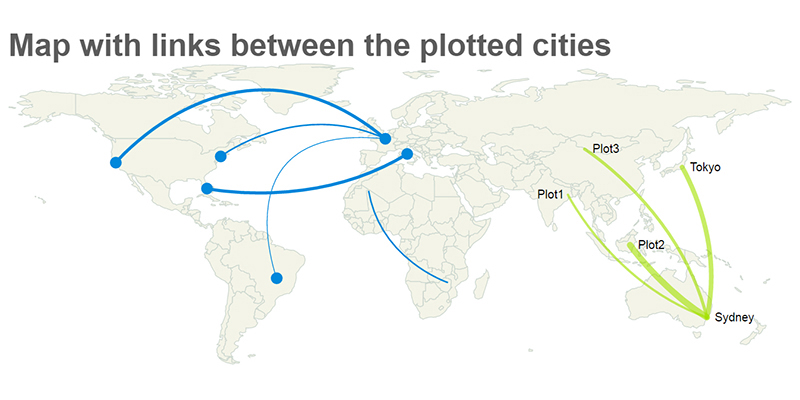
AnyMap is one of popular JavaScript (HTML5) charting libraries created by AnyChart. Just like amMap, it requires no big efforts to build a map using it as well as no external resources or third-party libraries such as jQuery. AnyMap also supports all basic types of series you might need – choropleth, bubble, dot, connector, and flow maps.
The list of key interactive features of AnyMap includes drill down for region-specific insights, events model for processing map viewer actions, and color scale for automatically coloring a map according to your settings instead of doing that manually.
This library is more similar to D3 than to amMap or Highmaps. It sort of combines out-of-the-box opportunities with being greatly extendable and controllable by a web app developer, and allows you to fully customize maps by adding, modifying and removing elements.
AnyMap’s binaries in a ZIP file include numerous examples, whereas AnyChart CDN stores hundreds of maps with a wide range of available formats – GeoJSON, TopoJSON, SHP, and SVG. This library features an extensive documentation and a very comprehensive and easy-to-understand API reference with lots of examples.
API reference: yes.
Dependencies: none.
Licensing: free (branded) or paid (from $79).
D3.js (by Mike Bostock)
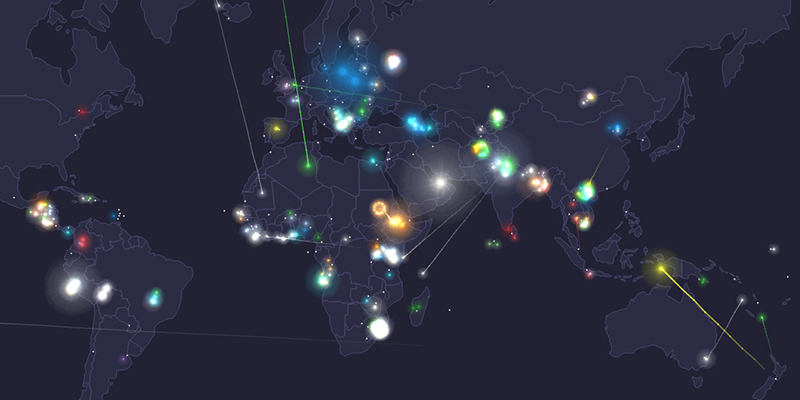
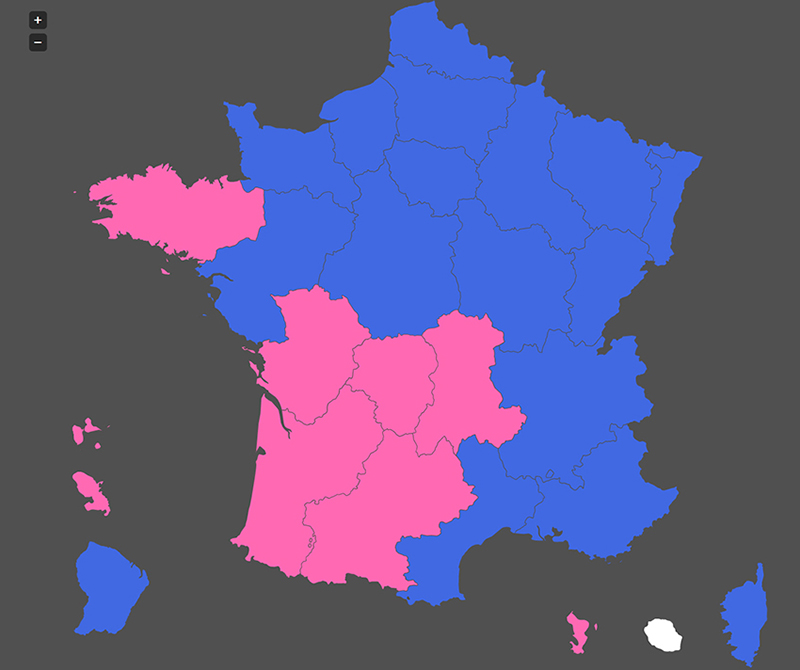
D3.js is a very powerful open source data visualization library in terms of what you can get with it in result. As opposed to the other JavaScript libraries listed in this article, D3 is more like a framework, which grants you the ultimate creative freedom but also makes building interactive maps less clear and obvious than with amCharts, AnyChart, or Highcharts solutions.
For example, to be able to code the awesome interactive map shown above, you should study quite a few bunches of information resources. However, I definitely should affirm that this is worth it because with D3 you can make a really fascinating geographical data visualization the world might have never seen before.
D3 features full map behavior customization, events model, and many other great features. It is perfect for web apps. Unfortunately, D3 does not provide its own maps, which means you will have to search for them in open sources by yourself, but that does not seem to be a big problem nowadays.
There is no documentation for this library, but you can find lots of tutorials, samples, and so on across the Internet, as well as use D3’s API which is described very well.
API reference: yes.
Dependencies: none.
Licensing: free.
Google GeoCharts (by Google)
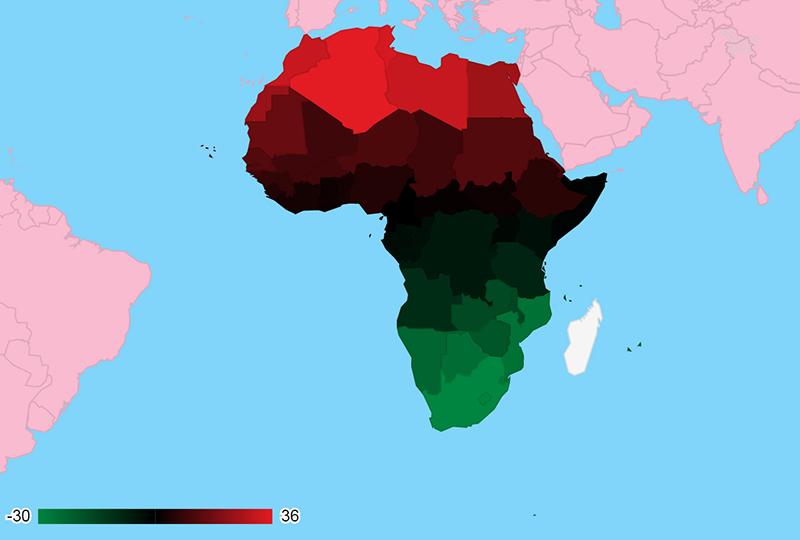
Google Charts is a JavaScript library created by Google for data visualization. It includes capacities to build interactive maps that are called geocharts here, obviously not to be confused with regular maps intended for displaying just the location of one or several objects.
The world map is the only map provided in Google GeoCharts. However, you may choose any region to zoom in when drawing.
Unfortunately, the API of GeoCharts does not support scrolling, zooming, or dragging. Also, Google does not offer anything but choropleth and bubble series for interactive map visualizations. These omissions made me quite sad one day, but the good thing is they finally became a trigger for me to start seeking after and researching other map libraries, and now here I am, sharing this experience with you.
All in all, GeoCharts is an excellent solution for those people and projects that do not require vast and complicated features but that need solid performance and stability rather than beauty and customization.
API reference: yes.
Dependencies: none.
Licensing: free.
Highmaps (by Highsoft)
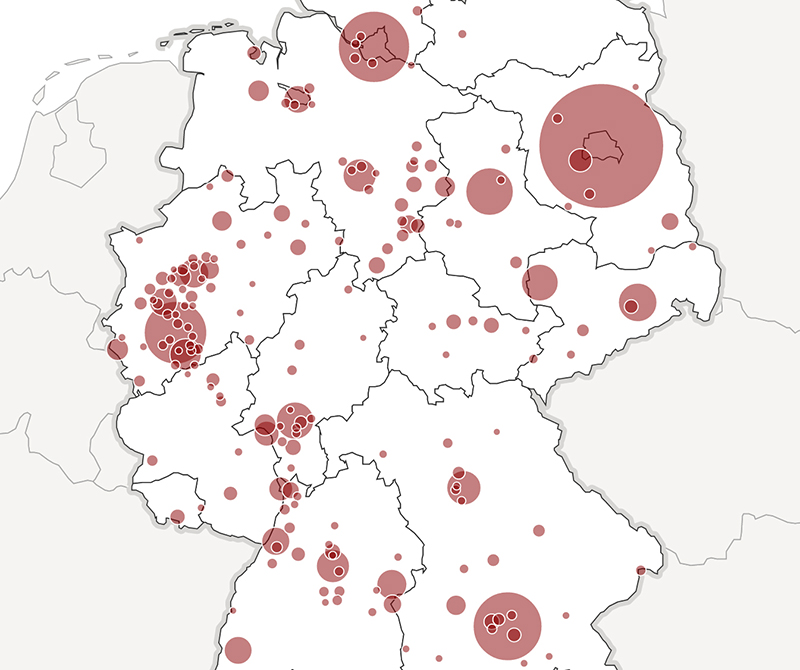
Highmaps library is a younger sister of Highcharts and Highstock, popular charting libraries developed by Norwayís Highsoft. Its core advantages are the open source nature with all its pros, light weight which ensures high rendering performance, and a vast set of interactive features such as drill down and others.
Among the series types supported in Highmaps are choropleth and bubble maps. It is also possible to draw lines to depict a road, a river, or a connector. However, making flow maps is not as simple as with amMap or AnyMap, for example. It is also worth noting that neither Highcharts nor Highmaps can work without jQuery, so you must have this dependency if you want to use them or choose another charting library.
A good thing is that Highmaps offer multiple ready-to-use maps in both SVG and GeoJSON. The documentation is quite extensive and is great at helping you understand the libraryís settings quite quickly and easily.
API reference: yes.
Dependencies: jQuery.
Licensing: free (branded) and paid (from $390).
jQuery Mapael (by Vincent Broute)
jQuery Mapael is another well-done open source library for building dynamic vector maps. It is based on jQuery and Raphael JS, which makes you deal with these dependencies when creating choropleth, bubble, or connector maps that are supported here.
Mapael offers a collection of maps on its own repository. Documentation and API descriptions are combined in one article but, actually, you can easily get started with this library just by reading this detailed tutorial.
API reference: yes.
Dependencies: jQuery and Raphael.
Licensing: free.
jVectorMap (by Kirill Lebedev)
jVectorMap is an open source library for interactive maps that requires jQuery. While this external dependency might make this library not too versatile, this should not a big problem for now because jQuery is #1 JavaScript library for websites both in terms of usage and market share.
Unfortunately, the choice of available series types is not really wide because jVectorMap has only choropleth and marker maps available. At the same time, we must do justice to this library since these are greatly elaborated. Also, markers can be represented as images, and the drill down and some other interactive features are available.
jVectorMap have quite a small API reference and does not feature Documentation as we know it, but there is a concise Getting Started tutorial which is still very helpful.
API reference: yes.
Dependencies: jQuery.
Licensing: free and paid (from $39).
Kartograph (by Gregor Aisch)
Kartograph is an open source solution with all its corresponding advantages. It is rich with visual effects such as shadow, blur, and so on. A peculiar thing is there is the 3D column (vertical bar) type of series available in addition to iconic choropleth and bubble series.
There is no ready-to-use map collection in Kartograph, but the library works with any SVG maps as well as offers a utility named Kartograph.py to create maps.
While Kartograph is not dependency-free as it requires both Raphael JS (used for drawing) and jQuery, it provides you with smooth mapping experience, whereas the libraryís documentation and API reference, combined in a single article, allow you to get interactive maps up and running in your projects in quite a nice and easy manner.
API reference: yes.
Dependencies: jQuery and Raphael.
Licensing: free.
Conclusion
All of these JavaScript map visualization libraries feature cross-browser compatibility that I believe is a must-have in the 21st century. Some of them provide no support of old browsers such as Internet Explorer 6, but maybe this should not be considered too topical anymore, nowadays and especially in the longer term.
All the free libraries I mentioned do a good job at building interactive maps. However, they do not provide such extensive support like commercial ones, and to be honest, are not that powerful in terms of customization, of course except for D3.
When speaking about commercial libraries – by the way, normally they are free for non-commercial use and trial – I cannot help bringing AnyMap and Highmaps to the forefront for their rich documentation and API references, as well as vast collections of live JavaScript map demos also featuring great interactivity options.
Thanks for reading this, and I do hope you find the article helpful in grasping the essence of the best JavaScript libraries for interactive map visualizations.
Please use the comments section below to share your own thoughts and insights as well as the names of your favourite libraries if they appear to be missing but worth mentioning. Have a wonderful day!


