
Without a doubt, website speed is one of the most important metrics that’s absolutely integral to not only the success of your website, but to the success of your Internet-based business as a whole.
The research backs this up. Back in July of 2018, Google officially instituted an update that they publicly dubbed the “Speed update”. Websites with slower page load speeds would be negatively impacted in the search engine rankings, as Google believes (rightfully) that it would do a disservice to its users by showing them websites that offer a slow, poor browsing experience.
But not only does the impact end with SEO, but website load speed can have a direct impact on your conversion rate. As per research done by Hubspot, a one second delay in page load times can have a -7% impact on conversions. What’s even more critical is that 79% of customers who are dissatisfied with the browsing experience of a website say that they would be less likely to buy again from the same website, which hurts your reputation with your customer base and reducing chances of repeat sales.
Clearly, a slow website is the last thing you need in 2019. But if you do currently have unfavorably long page load times, where do you start fixing that?
That’s where speed testing tools start to come in. To start boosting your website speed, you first have to figure out what’s slowing your website down, and nothing accomplishes that job better than speed testing tools.
In this article, we’re going to take a closer look at one of the most popular, fully-featured speed testing tools out there: GTMetrix.
What to Look for in a Speed Testing Tool
Before we break down GTMetrix in a full analysis, let’s first make sure we know what we’re looking for in a speed testing tool.
In-Depth Detail
The first key ingredient to a solid website speed testing tool is obvious: detail. If all you’re getting is a cursory load time, with no breakdown of what elements of your website take time to load, no recommendations on what to improve, and no analysis of what you’re already doing well, then forget it. You’ll be just as blind as you were before you took the test.
With page load time, the devil is indeed in the details.
Location-Based Testing
If the speed testing tool only has servers in one location, that could be a problem. If your website is hosted on a server geographically based in England, then naturally servers from England are going to have shorter load times when they pull up your website, potentially hiding weak spots your website has for speed improvement.
To ensure that you’re getting a comprehensive look at the big picture, the speed testing tool you use should have the capacity to test from multiple servers based all around the world, so you can make sure you’re delivering a fast experience that’s consistent for all your traffic no matter where they’re located.
Monitoring Capability
Several of the factors that impact page load speed are variable. I.e., you can impact them over time as you make changes to your website with new content or new structure. A speed testing tool with a monitoring capability can test your website regularly and send reports of its page load speed straight to your inbox so you know if any of your latest updates are messing anything up.
Otherwise, you could easily make what may seem to be a small change to your website that has huge negative ramifications for your page load time, turning away visitors and potential customers.
How to Use GTMetrix
Now that we know what we’re looking for, it’s time to take a deeper dive into GTMetrix’s functionality.
First off, the tool is completely free to use. All you have to do is click this link, enter your URL in the textbox provided, and hit “Analyze” (pictured below). There is a pro version of the tool with premium features, but we’ll cover that later on in this post.
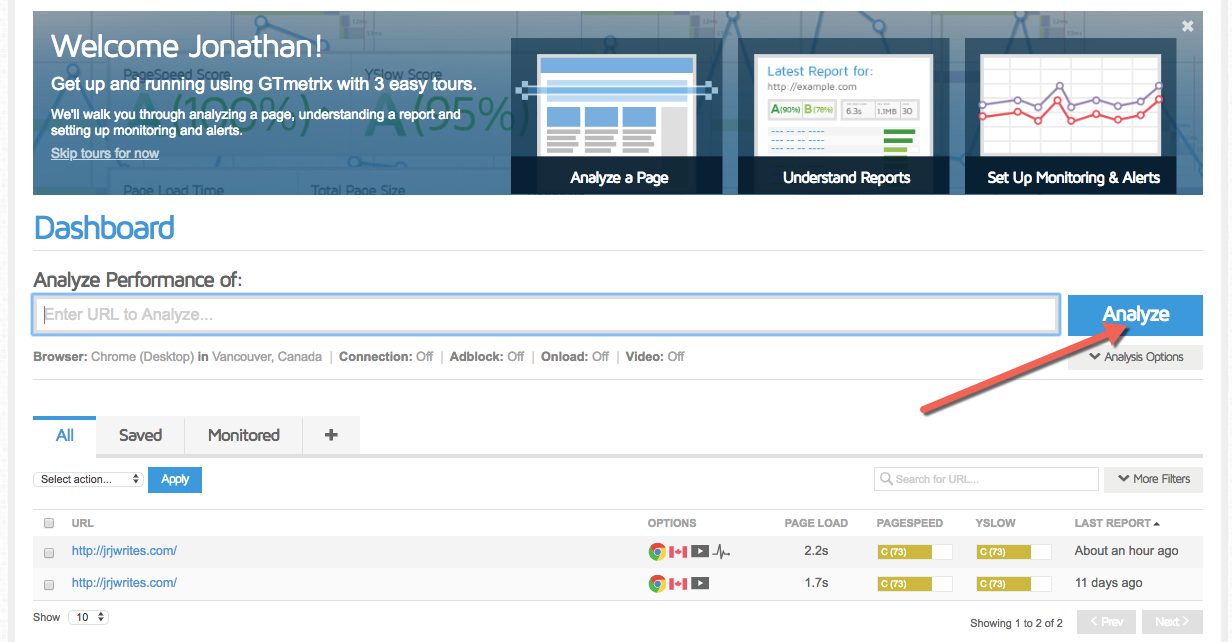
For the purposes of this post, we’ll be analyzing my personal portfolio website.
Once the test finishes running, you’ll be presented with a dashboard of all the basic at-a-glance information you need:
- Load time
- Page size
- Total requests
- Percentile score comparing you to other tested websites
Clicking on the tabs below allows you to delve deeper. Pagespeed and YSlow are going to be the most important ones here for you, as each tab contains one of the ways website speed is measured and recommendations are determined. They both accomplish the same function (telling you how to improve your website’s speed with specific recommendations), but use different techniques to arrive to those conclusions.
The waterfall tab takes you request-by-request to show you which requests take the most load time on your website. The timings tab offers a neat visualization, the video tab offers a video of how your page loads, and the history tab shows your performance over time.
Pagespeed
The Pagespeed technique gives you a list of 27 recommendations for page speed, and your website’s performance on each. The list covers everything from optimized images, metadata, CSS and Javascript structure, link structure, and more.
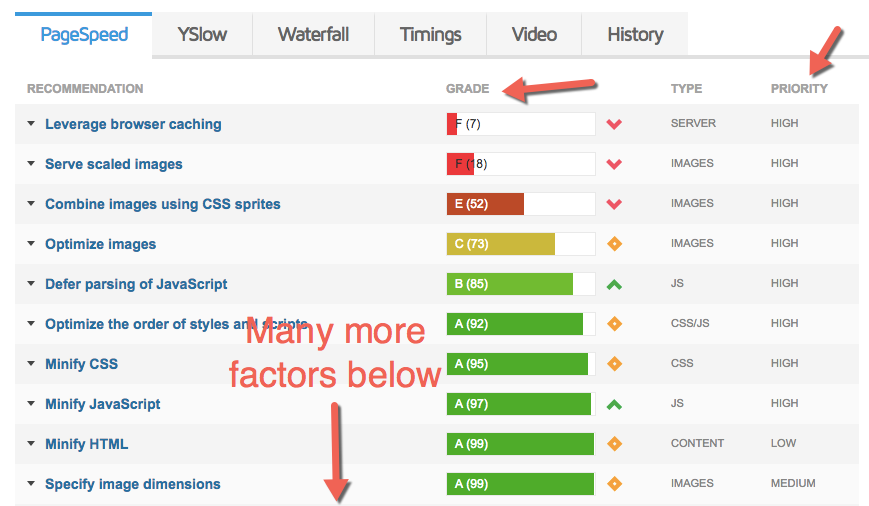
GTMetrix orders these recommendations based on your website’s performance on each, from worst to best. In my case, the aspects that my website is doing the worst in are browsing caching, resizing images before upload, combining images into CSS sprites, optimizing image size/quality, and deferring Javascript parsing.
The recommendations also show you how much of a factor they are in the priority column. For instance, combining my images into CSS sprites are a high-priority, high-impact factor, but minifying HTML? Less so.
YSlow
The YSlow technique is similar to Pagespeed and has very similar information. It offers 19 recommendations and again orders your performance on each from worst to best.
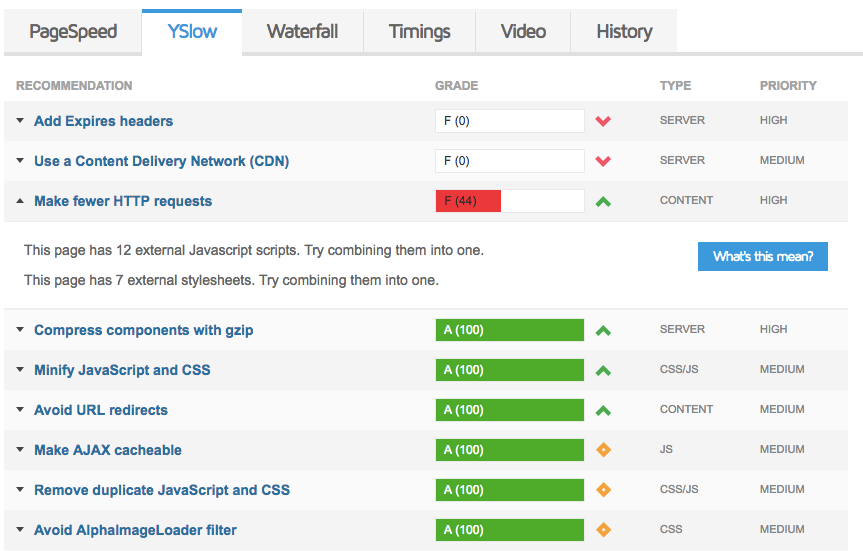
On my website, I need to add expire headers, start using a CDN, and make fewer HTTP request.
You again get to see the priority of each recommendation on the low-medium-high scale. Interestingly, there are far fewer high priority recommendations in the YSlow technique than were listed on Pagespeed, as per GTMetrix’s scaling system.
Waterfall
The waterfall chart shows you the load time of each request your website makes. If you’re unfamiliar with them, waterfall charts can appear daunting at first look, but understanding them isn’t difficult by any means; take a look at this quick guide if you have any trouble.
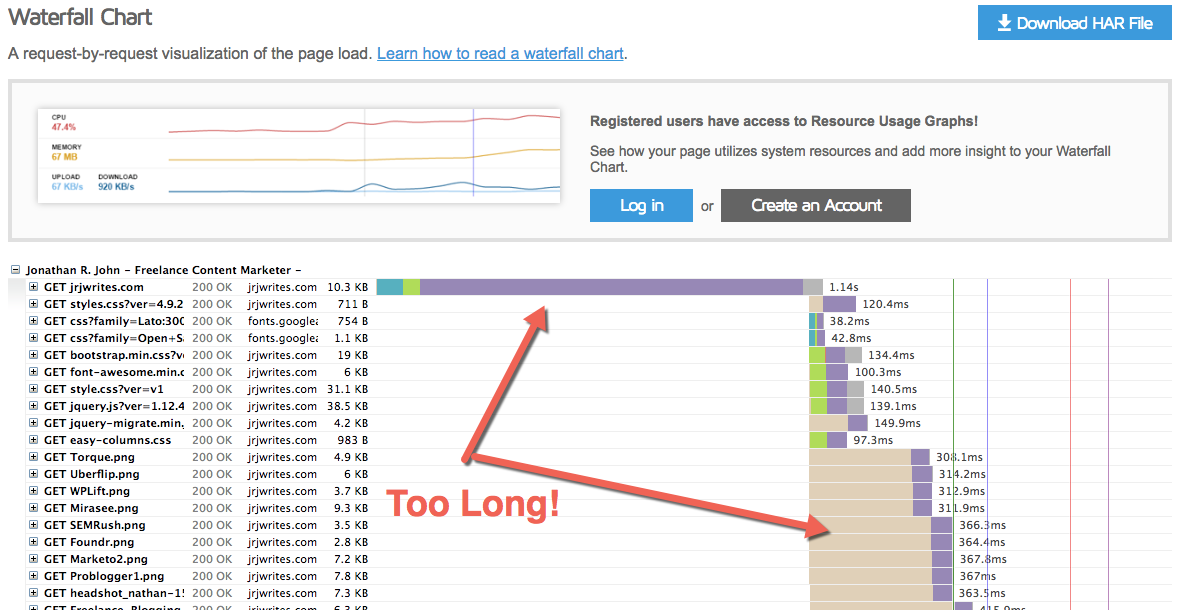
Generally, a good waterfall has a low number of requests, and each bar (indicating load time of that particular request) is relatively short. The longer bars identify for you the problem requests.
My website makes about ~50 requests, which isn’t too shabby, but the time to request the URL is 1.14 seconds, which is far too long. This potentially identifies a problem with my hosting service. The image requests as well are all fairly long, indicating that I need to start caching images and optimizing their file size, which may mean I need to sacrifice image quality at some points.
Timings
The timings tab is open only to registered members (still free, all you have to do is create an account, which takes about ~20 seconds).
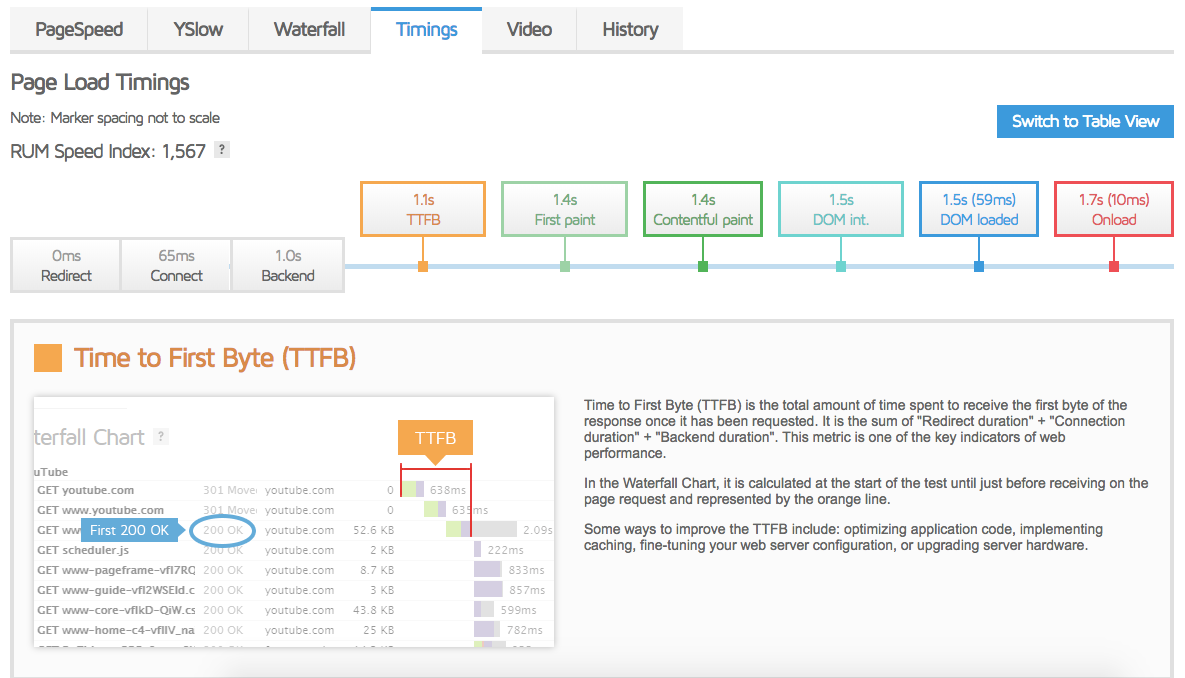
It visualizes for you the timings it takes to hit all of the important milestones in the loading of your website:
- Time to first byte (TTFB — time to receive first byte of information).
- First paint (time to first render on the page).
- Contentful paint (time to first render any content like text or images on the page).
- DOM int (time to when the browser has loaded and parsed the HTML, building a “Document Object Model”).
- DOM loaded (the DOM is loaded and interactive).
- Onload (all resources have finished downloading).
All of this can technically be visualized in the Waterfall chart, but is much easier to see in the Timings tab.
Video
The video option is another feature open to registered users only, but it’s pretty neat. It shows you a video breakdown of your website loading, indicating the key milestones analyzed in the Timings tab.

I don’t see how it provides any particular information beyond what you’d have identified in the Waterfall and Timings, but it’s a neat feature regardless.
History
Last but not least, GTMetrix keeps track of all the times that you use its service to test your website’s load time. This allows you to see how your website speed has changed over time.
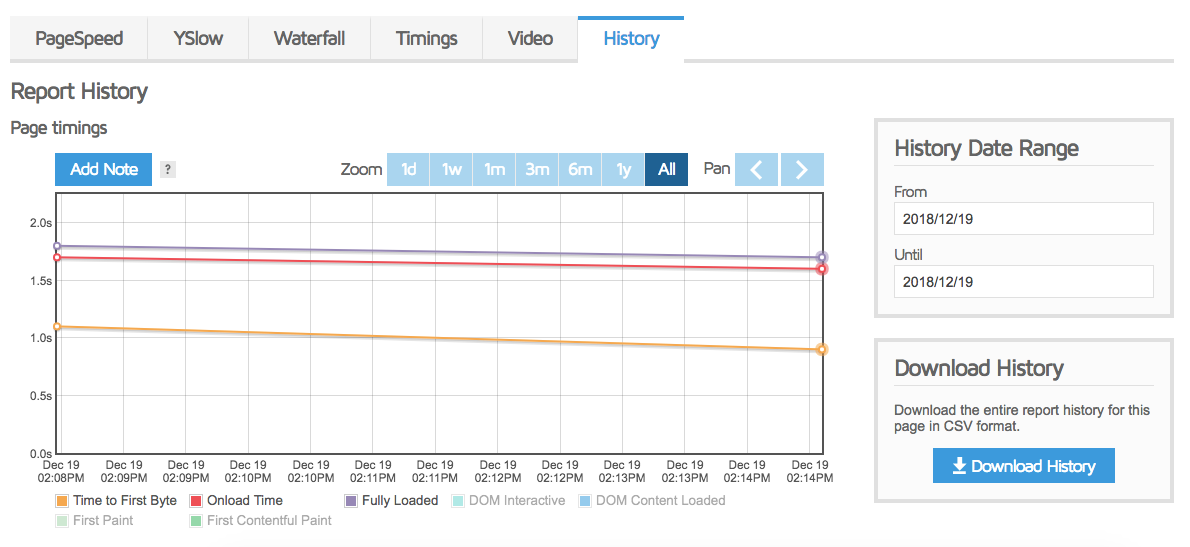
Of course, if you haven’t tested your website much, you’ll have very few historical reports to look at, but over time it will allow you to see how much you’ve improved and how any changes you make to your website impacted its speed.
Monitoring
Any speed testing tool worth its salt will have this incredibly important feature: monitoring. This functionality ensures that your website’s speed is regularly tested at specified intervals, and you’re sent a report to see how your website is performing without even having to go to the tool’s website.
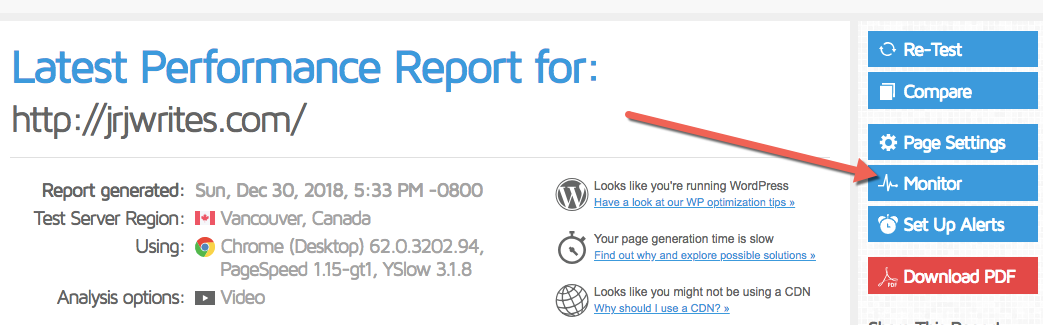
To use GTMetrix’s monitoring tool, hit “Monitor” on the top right once you’ve created a free account and verified your email address.
You can choose from daily, weekly, and monthly monitoring (we recommend daily). Pro users have access to hourly monitoring.
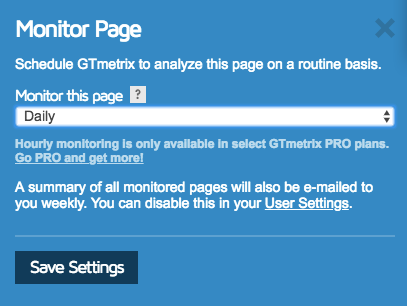
Whatever frequency you choose, a summary of your site’s performance is sent to your email every week. Not only does monitoring save you from having to run your site through the speed testing service, but it also reminds you with the weekly email to be keeping track of your website’s load times while you deal with all the hundred other aspects of your Internet business.
GTMetrix Negatives and Alternatives
There’s not a lot to fault with GTMetrix, especially considering the functionality it gives away for free, but there’s always room for improvement.
Location
One of the biggest niggles I have with the GTMetrix tool is that the free version doesn’t allow you to change or set the location of the test; all of the tests I ran were from a server in Vancouver, Canada. As we discussed in the introduction to this post, location-based testing is crucial to ensuring that you’re delivering a consistently speedy service to all your traffic.
Browser-Based Testing
Another option GTMetrix doesn’t have in its arsenal is browser-based testing to see how your website performs when viewed in different browsers. Given that most Internet users nowadays use either Safari or Chrome, and that experiences in both are relatively consistent, this isn’t a major factor.
Alternatives
There’s a ton of speed testing tools out there, so let’s take a quick look at some of the alternatives to GTMetrix.
Pingdom—lovely slick UI, location-based testing, and the works. Unfortunately, the free version doesn’t allow monitoring.
Google Pagespeed Insights—Google’s own speed-testing tool that’s highly popular with webmasters. Not the most comprehensive tool in the toolbox, however, as it lacks both monitoring as well as a detailed waterfall chart.
WebPageTest—very full-featured tool with super-detailed results, monitoring, tons of location options as well as mobile-testing options. The only con here is a fairly unattractive/old-fashioned UI.
GTMetrix PRO – Worth it or Not?
GTMetrix offers a whole host of premium options. But are they worth the money you shell out?
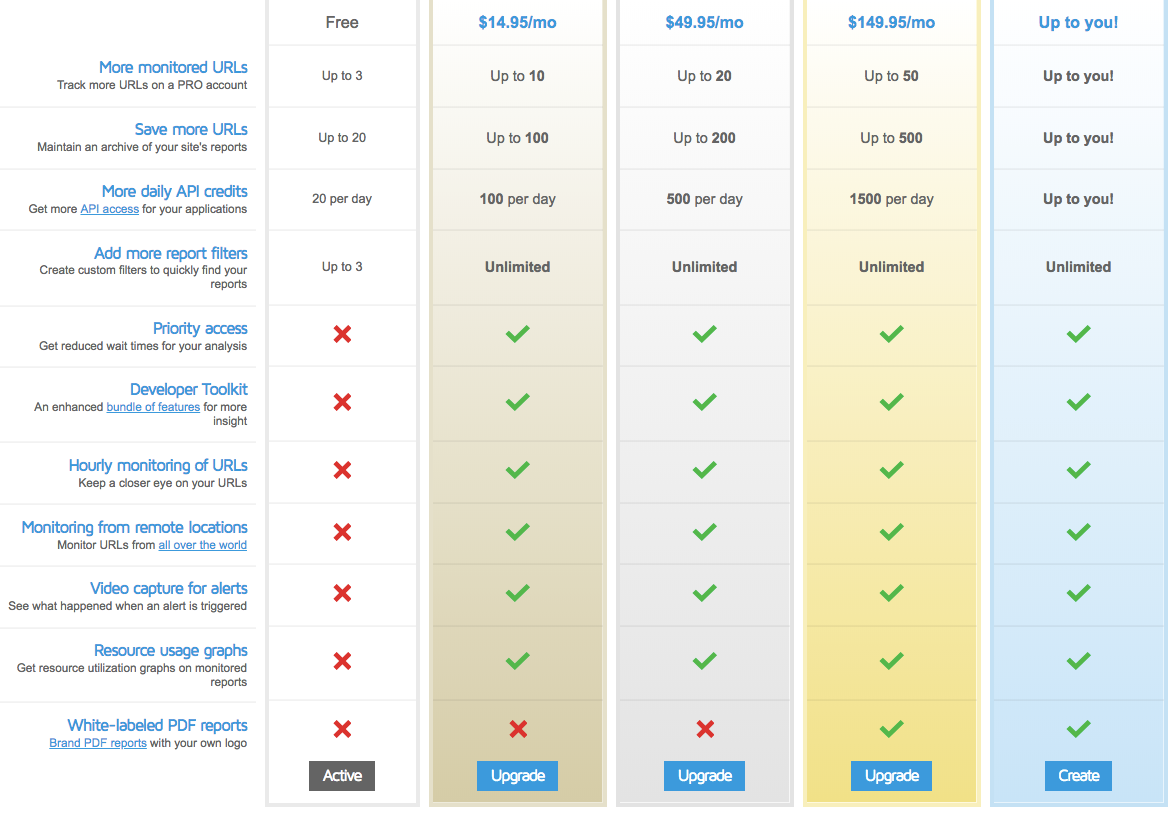
For most webmasters reading this post, you’ll be looking at the Bronze plan for $14.95/month as most of our readers have less than three websites that they’d want to monitor.
The major differentiators from the bronze and free plans is that the paid version gets you hourly monitoring, location-based testing, a developer toolkit, and report filters to better analyze your page speed data.
Of those features, the location-based testing and the report filters are the ones that are really worth anything. Hourly monitoring is cool, but given that reports are emailed only weekly, it may not truly do anything for additional insight.
$14.95/month for those two features is a steep price, especially considering tools like WebPageTest doing the same for free.
Overall
For me personally, the GTMetrix PRO version simply wouldn’t be worth the cost. My free account with the tool give sme pretty much everything I need, save location-based testing.
The tool’s sleek UI and powerful base-level functionality make it a formidable player in the pagespeed-testing space. Now that I have the monitoring feature in my webmaster toolbox, I’ll doubtless be using GTMetrix for years to come.


